(For New York Times selected headlines please scroll down the page)
 Planetary Aspects XY-display for 1929 to 1932 clearly shows that all
cycles prediction lines fall continuously below the X-axis (red line),
corresponding to the great depression. Watch the lines change from year
to year by itself.
Click on a year below to display XY Planetary Aspect (weight or intensity) Strength.
Data from 1934 to 1995 available on request.
For forcast and Predictions by the month or the year email akwugm@gmail.com for info.
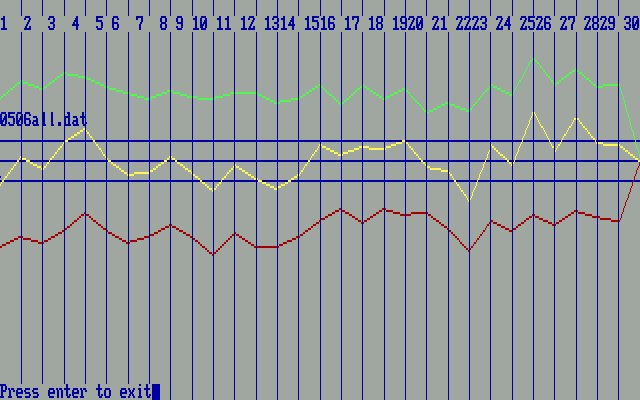
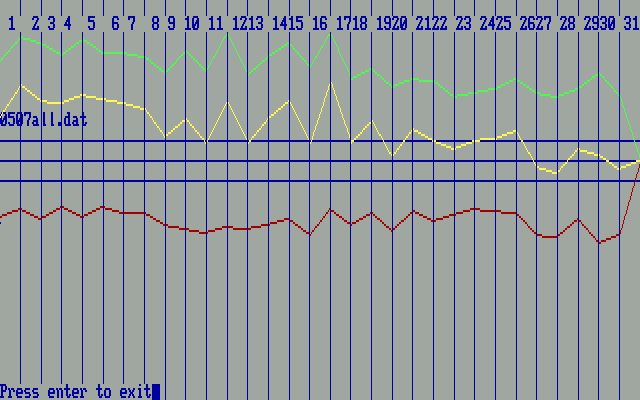
June and July 2005 forcast is displayed below. This is just a sample of what is available.
Notes to 1995 : 1995 xy planetary aspecting strength display. Note that 3 out of 4 lines are significantly postive (above X-axis) starting November, indicating a rise in December. (xy aspect strength display leads market by 1-3 weeks.) Notes to 1996 : 1996 xy planetary aspecting strength display and hence prediction for 1996's stock market rise and fall. Note continual rise of aspect strength from December 1995 to end of June 1996, indicating a significant and continuous rise of the Stock Market till at least April - June 1996. (Aspect strenght line begins to level off in April, but remains positive till June 1996.) |